

Founder's View Overview
The Founder's View provides financial forecasting and scenario planning to help you model your company's financial future. View historical actuals alongside forecasted projections, adjust assumptions through preset or custom scenarios, and analyze key metrics like runway, burn rate, and gross profit margins. Export professional financial models for board meetings, investor presentations, or strategic planning.
Accessing Founder's View
Navigate to Founder View in the left sidebar. The page displays your historical financial data combined with forward-looking projections based on your selected scenario.

Page Layout
Time Period Selection
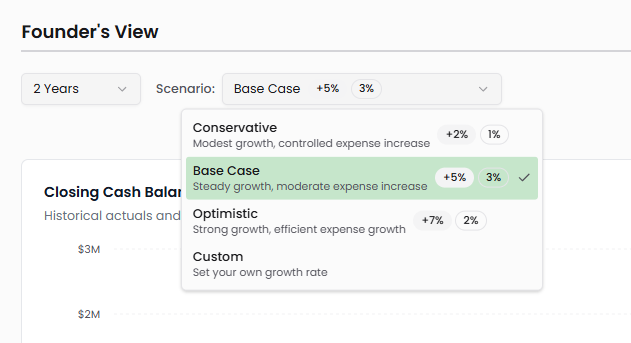
The time period dropdown at the top left controls how much data appears in your view. Choose between 1 Year or 2 Years to adjust the timeframe displayed in both the chart and table. This affects only what you see on screen, not the underlying data.
Why it matters: One-year views provide detailed month-by-month analysis for near-term planning, while two-year views help with longer-term strategic decisions and fundraising scenarios.
Scenario Selection
The scenario dropdown controls the assumptions driving your financial forecast. Four scenario options are available:
Conservative: Modest growth, controlled expense increase
Base Case: Steady growth, moderate expense increase (typically +5% revenue, +3% expenses)
Optimistic: Strong growth, efficient expense growth (typically +7% revenue, +2% expenses)
Custom: Set your own growth rates for revenue and expense optimization
Each preset scenario applies specific monthly growth rates to revenue and expense reduction percentages to your forecast. When you select a scenario, all forecast values update immediately to reflect the new assumptions.
Why it matters: Scenario planning helps you understand how different growth trajectories affect your cash position, runway, and funding needs. Conservative scenarios support risk planning, while optimistic scenarios help model best-case outcomes for investor presentations.
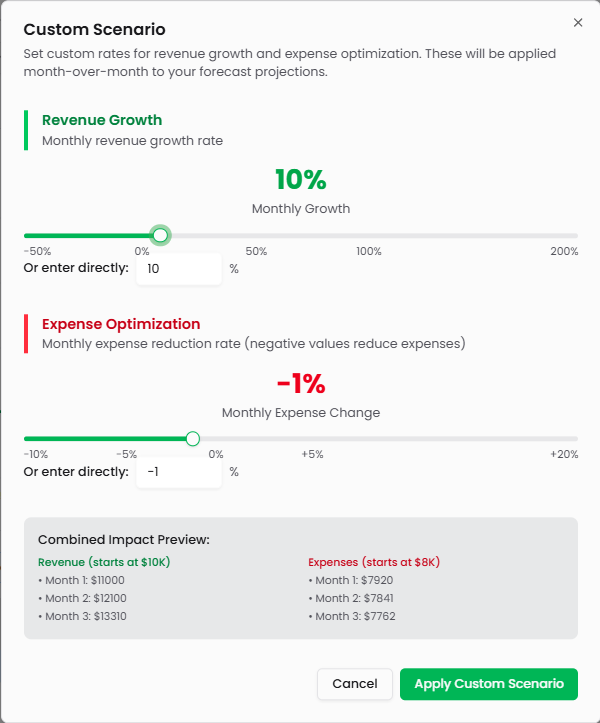
Custom Scenario Builder
Click the Custom scenario option to open the scenario builder modal. This interface lets you define your own assumptions for revenue growth and expense optimization.
Revenue Growth: Set the monthly revenue growth rate using the slider or by entering a percentage directly. The range spans from -50% to +200%, allowing you to model both declining and hypergrowth scenarios. The "Monthly Growth" indicator shows your selected rate in real-time.
Expense Optimization: Set the monthly expense reduction rate (or increase, if needed) using the slider or direct entry. Negative values reduce expenses month-over-month, while positive values increase them. The range spans from -10% to +20%.
Combined Impact Preview: The preview section shows how your selected rates affect the first three months of projections. Revenue starts at your most recent actual and compounds monthly at the growth rate. Expenses start at your recent actual and adjust monthly by the optimization rate.
Click Apply Custom Scenario to update your forecast with these assumptions. The modal closes and all forecast values recalculate based on your custom rates.
Why it matters: Custom scenarios let you model specific business situations beyond the presets—aggressive expansion plans, cost-cutting initiatives, seasonal variations, or unique growth trajectories based on product launches or market entry timing.
Closing Cash Balance Chart
The chart visualizes your historical and forecasted cash balance over time. Solid green bars represent actual historical cash balances from your connected accounts. Striped green bars represent forecasted cash balances based on the selected scenario and projected revenue/expense patterns.
The x-axis shows months across your selected time period. The y-axis displays dollar amounts for your cash position. A trend line may appear to indicate the overall trajectory of your cash balance.
The Collapse Chart button in the top right hides the chart entirely, giving you more space to focus on the detailed financial table below. Click again to restore the chart.
Why it matters: The cash balance chart provides immediate visual insight into whether you're burning cash or generating positive cash flow. The transition from solid to striped bars shows where actuals end and projections begin, helping you assess forecast confidence based on how far you're projecting from known data.
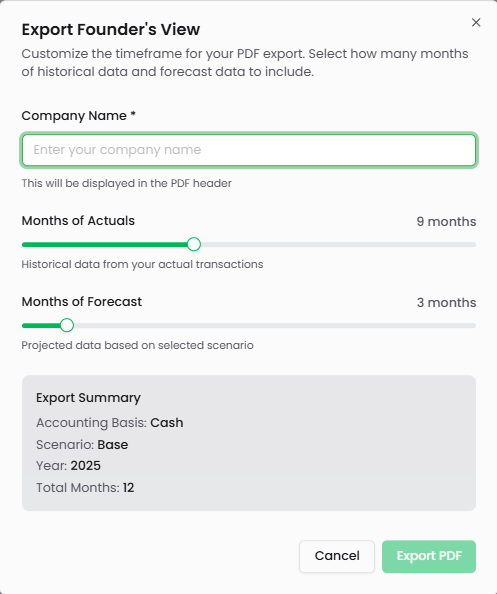
Export to PDF
Click Export PDF in the top right to open the export customization modal. This interface lets you create professional financial reports for investors, board members, or internal planning.
Company Name: Enter your company name (required field). This appears in the PDF header for professional presentation.
Months of Actuals: Use the slider to select how many months of historical data to include (1-9 months available based on your historical data). The label shows "Historical data from your actual transactions."
Months of Forecast: Use the slider to select how many months of projected data to include (1-3 months shown, but can extend up to 24 months). The label shows "Projected data based on selected scenario."
Export Summary: The summary box displays your selections:
Accounting Basis: Cash (indicating cash-basis accounting)
Scenario: The currently selected scenario (Base, Conservative, Optimistic, or Custom)
Year: The year being exported
Total Months: Combined count of actual and forecast months
Click Export PDF to generate and download your financial model. Click Cancel to close the modal without exporting.
Why it matters: Professional PDF exports enable you to share financial projections with stakeholders without giving them direct access to your Futureproof account. Customizable date ranges let you tailor reports for different audiences—more historical context for board meetings, more forward-looking data for investor pitches.
Financial Table Structure
The table below the chart shows detailed month-by-month financial data organized into major sections: Cash Infusion, Opening Balance, Revenue, Revenue Totals, Expenses, Expense Totals, Card Balance, Closing Balance, and Key Metrics.
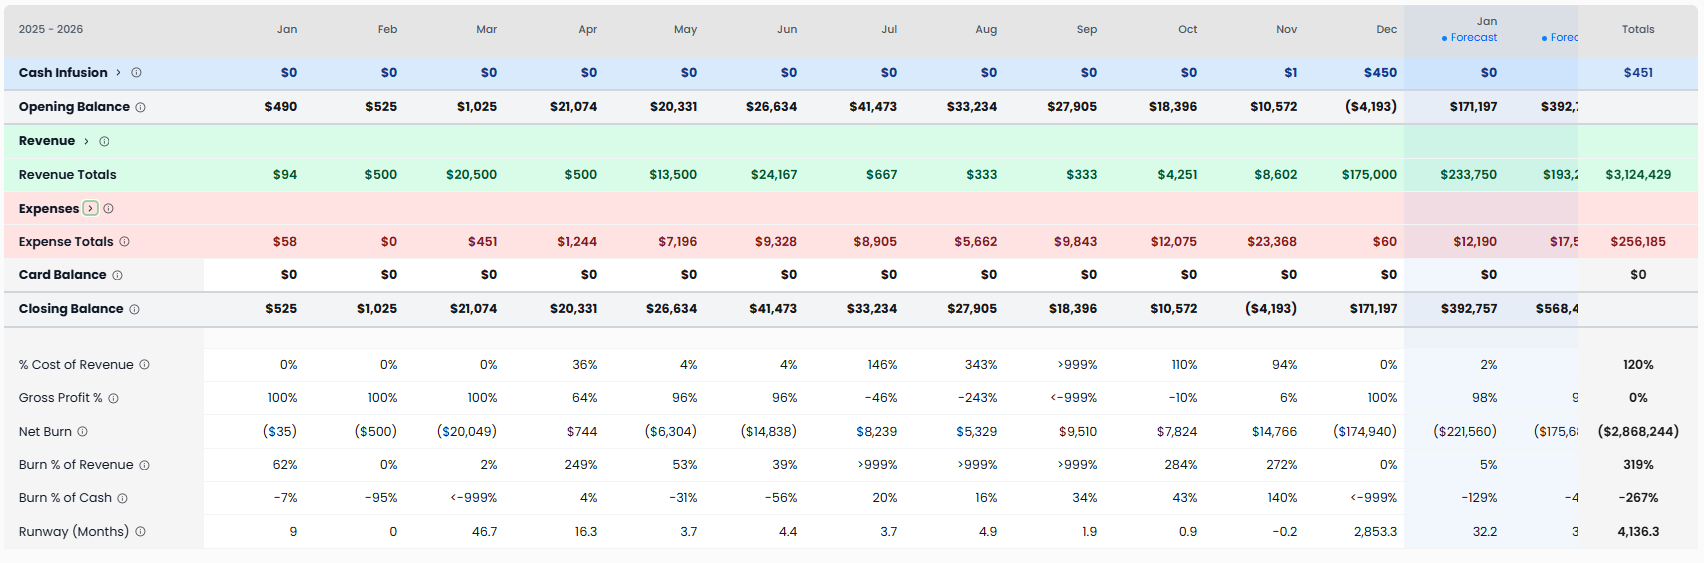
Understanding Table Columns
Each column represents one month, starting from your selected time period's beginning. Historical months show actual data from your transactions, invoices, and connected accounts. Future months show forecasted projections based on your selected scenario.
The rightmost columns are labeled with blue "Forecast" and "For" headers, indicating projected values. A "Totals" column on the far right sums each row across all displayed months.
Date Format: Column headers display abbreviated month names and two-digit years (e.g., "Jan 25", "Feb 25").
Cash Infusion
The Cash Infusion section tracks incoming financing and capital events. Each row represents a different funding source or debt instrument from your cap table and financing structure:
Founder Loan Payable: Loans from founders to the company
Line of Credit: Revolving credit facilities
Loans Payable: Term loans or other debt financing
Convertible Notes Payable: Convertible debt instruments
SAFE Notes Payable: Simple Agreement for Future Equity instruments
Payroll Liabilities: Accrued payroll obligations
Due to Affiliate: Amounts owed to affiliated entities
Venture Debt: Venture debt financing
Merchant Cash Advance: MCA financing
Common Stock: Equity financing from common stock issuance
Preferred Stock - Seed: Seed round equity financing
Preferred Stock - Series A: Series A equity financing
Preferred Stock - Series B: Series B equity financing
Additional Paid-in Capital - Common: APIC from common stock
Additional Paid-in Capital - Preferred: APIC from preferred stock
Treasury Stock: Treasury stock transactions
These rows are populated from your existing cap table and financing history. Forecast values for future months can be edited by double-clicking to model planned fundraising or debt draws.
Why it matters: Cash infusion tracking shows when and how much capital enters your business. Modeling future financing rounds helps you determine optimal fundraising timing and amounts based on projected runway.
Opening Balance
Shows your cash position at the start of each month. The opening balance for each month equals the closing balance from the previous month. The first month's opening balance comes from your actual cash position at that time.
Why it matters: Opening balance provides the starting point for each month's cash flow calculation, connecting the cash position from one period to the next.
Revenue
The Revenue section breaks down income by category, matching the classifications from your Revenue Dashboard:
SaaS Subscription Revenue: Recurring subscription income
Professional Services Revenue: Consulting and services income
Onboarding Fees: One-time setup and implementation fees
Collections from AR: Accounts receivable collected during the month
Affiliate Revenue: Income from affiliate partnerships
Partnership Revenue: Revenue from partnership agreements
Usage Revenue: Usage-based pricing income
Transactional Revenue: Transaction-based fees
Revenue (Contra): Contra-revenue items like discounts or returns
Historical months display actual revenue from your transactions and Stripe data. Forecast months project revenue based on your selected scenario's growth assumptions applied month-over-month to your most recent actuals.
Double-click any blue forecast value to edit it manually. This overrides the scenario calculation for that specific cell, allowing you to model one-time revenue events, seasonal variations, or custom growth patterns. Edited cells remain blue but reflect your manual entry rather than the scenario calculation.
Why it matters: Revenue projections determine whether your business can achieve profitability from operations or requires external financing. Breaking revenue into categories helps identify which streams drive growth and which need attention.
Revenue Totals
Displays the sum of all revenue categories for each month. This row automatically calculates based on the revenue line items above it, whether those are actuals, scenario-driven forecasts, or manually edited projections.
Why it matters: Total revenue provides the top-line growth metric for your business and drives many downstream calculations like burn rate percentages and gross profit margins.
Expenses
The Expenses section organizes spending into major categories matching your chart of accounts structure:
Cost of Revenue: Direct costs associated with delivering your product or service. May include subcategories visible when expanded.
Payroll: All personnel costs including salaries, benefits, and payroll taxes. Forecast values can be edited to model hiring plans or compensation changes.
Sales & Marketing: Customer acquisition and marketing expenses including:
Content & Creative Contractors
Marketing and Advertising
Meta (Facebook/Instagram advertising)
Sponsorships & Events
Marketing Tools & CRM
Paid Advertising
Promotional Products
Research & Development: Product development and engineering costs. Forecast values can be edited to model R&D investment scenarios.
General & Administrative: Operational overhead including office expenses, professional services, insurance, and administrative costs.
Other Operating Expenses: Additional operating costs not categorized elsewhere.
Other Income/Expense: Non-operating income or expenses.
Historical months show actual spending from categorized transactions. Forecast months apply your scenario's expense optimization rate (or custom rate) month-over-month. Negative optimization rates reduce expenses gradually; positive rates increase them.
Double-click any blue forecast value in the Payroll or Other Operating Expenses rows to edit manually. This overrides the scenario calculation for that cell, letting you model specific hiring events, planned cost reductions, or known expense changes.
Why it matters: Detailed expense forecasting reveals where cash is consumed and helps identify optimization opportunities. Breaking expenses into categories supports departmental budget planning and helps you understand unit economics.
Expense Totals
Sums all expense categories for each month. This row auto-calculates based on the expense line items above, incorporating both scenario-driven forecasts and any manual edits you've made.
Why it matters: Total expenses combined with total revenue determines your monthly burn rate and path to profitability.
Card Balance
Displays your outstanding credit card balance for each month. This reflects amounts owed on connected business credit cards. Historical months show actual balances; forecast months project based on expected card usage patterns.
Why it matters: Card balances represent obligations that affect your true cash position. High card balances offset reported cash and should be factored into runway calculations.
Closing Balance
Shows your projected cash position at the end of each month. Calculated as:
Opening Balance + Cash Infusion + Revenue - Expenses - Card Balance Payments = Closing Balance
The closing balance for each month becomes the opening balance for the next month, creating a continuous cash flow timeline.
Closing balances in forecast months reflect your scenario assumptions plus any manual edits you've made to revenue, expenses, or cash infusion. When the closing balance goes negative, you've run out of cash under that scenario.
Why it matters: Closing balance is your most critical metric for survival. It tells you whether the business can continue operating and for how long at the current trajectory.
Key Metrics
The bottom section displays auto-calculated performance metrics for each month:
% Cost of Revenue: Cost of Revenue ÷ Total Revenue × 100. Shows what percentage of revenue is consumed by direct costs of delivering your product or service. Lower percentages indicate better unit economics.
Gross Profit %: (Revenue - Cost of Revenue) ÷ Revenue × 100. Measures profitability after direct costs but before operating expenses. SaaS businesses typically target 70-90% gross margins.
Net Burn: Total Expenses - Total Revenue. Positive numbers indicate you're spending more than earning (burning cash). Negative numbers indicate positive cash flow (earnings exceed spending).
Burn % of Revenue: Net Burn ÷ Total Revenue × 100. Shows burn rate as a percentage of revenue. Helps assess efficiency relative to revenue scale.
Burn % of Cash: Net Burn ÷ Closing Balance × 100. Shows monthly burn as a percentage of remaining cash. Higher percentages indicate faster depletion of reserves.
Runway (Months): Closing Balance ÷ Average Monthly Net Burn. Calculates how many months your current cash will last at the current or projected burn rate. Shows "∞" (infinity) when you have positive cash flow.
Why it matters: These metrics provide quick health checks on your business. Deteriorating gross margins suggest pricing or COGS problems. Increasing burn percentages indicate acceleration toward cash depletion. Declining runway signals the need for revenue acceleration, expense reduction, or fundraising.
Working with Forecast Data
Editing Individual Forecast Values
Locate a cell in the forecast columns (marked with blue "Forecast" headers). Only certain rows are editable: Revenue categories, COGS, Payroll, and Other Operating Expenses. Double-click the blue value to activate edit mode. The cell becomes an input field where you can type a new number. Press Enter or click outside the cell to save your change.
The edited value overrides the scenario calculation for that specific month and category. The cell remains blue but now reflects your manual input rather than the scenario-driven projection. This edit persists even if you switch scenarios—your manual values always take precedence.
To restore scenario-based calculation for a cell you've edited, you'll need to manually re-enter the scenario's calculated value or switch scenarios and re-switch back to reset.
Why it matters: Manual edits let you incorporate known events into your forecast—a large customer contract starting in Q3, a planned headcount freeze in Q2, or seasonal revenue patterns. This combines the efficiency of scenario modeling with the precision of manual forecasting.
Understanding Edited vs. Calculated Values
All forecast values appear in blue to distinguish them from black historical actuals. However, not all blue values are calculated the same way:
Scenario-driven forecasts: Apply growth or optimization rates month-over-month from the most recent actual. These update automatically when you change scenarios.
Manually edited forecasts: Reflect specific values you've entered by double-clicking. These do not update when you change scenarios—your manual input is preserved.
Cascade effects: When you edit a revenue or expense value, all downstream calculations update automatically. Changing revenue in a forecast month recalculates Revenue Totals, Gross Profit %, Net Burn, and Closing Balance for that month and all subsequent months.
Why it matters: Understanding which values you've customized versus which are scenario-driven helps you maintain forecast integrity. You can build hybrid models that use scenario assumptions as the baseline while incorporating known events as manual adjustments.
Switching Between Scenarios
Click the scenario dropdown and select a different option. All forecast values recalculate immediately based on the new scenario's assumptions, except for cells you've manually edited—those retain your custom values.
The chart updates to reflect the new projections. Runway, burn rates, and closing balances adjust based on the different growth and expense assumptions.
Conservative to Optimistic: Switching from conservative to optimistic increases revenue growth rates and decreases expense growth rates, typically extending runway and improving cash position in forecast months.
Base to Custom: Switching to custom opens the scenario builder where you define your own rates. After applying, the forecast reflects your custom assumptions.
Why it matters: Rapid scenario switching lets you quickly model different outcomes for board discussions, investor presentations, or strategic planning. You can demonstrate sensitivity to growth rates or show how expense discipline affects survival.
Understanding Forecast Calculations
Revenue Growth Application
Revenue forecasts start from your most recent actual monthly revenue and apply the scenario's growth rate month-over-month.
Formula: Next Month Revenue = Current Month Revenue × (1 + Growth Rate)
For example, with Base Case (+5% monthly growth) and $10,000 actual revenue in the last historical month:
Forecast Month 1: $10,000 × 1.05 = $10,500
Forecast Month 2: $10,500 × 1.05 = $11,025
Forecast Month 3: $11,025 × 1.05 = $11,576
This compounds over time, creating exponential growth curves with positive rates or exponential decline with negative rates.
Expense Optimization Application
Expense forecasts start from your most recent actual monthly expenses and apply the optimization rate month-over-month.
Formula: Next Month Expenses = Current Month Expenses × (1 + Optimization Rate)
For example, with Base Case (+3% monthly expense increase) and $8,000 actual expenses in the last historical month:
Forecast Month 1: $8,000 × 1.03 = $8,240
Forecast Month 2: $8,240 × 1.03 = $8,487
Forecast Month 3: $8,487 × 1.03 = $8,742
Negative rates reduce expenses over time. A -1% rate applied to $8,000 expenses yields $7,920, then $7,841, then $7,762 in successive months.
Custom Scenario Calculations
Custom scenarios work identically to presets but use the specific growth and optimization rates you define in the scenario builder. The preview in the modal shows exactly how your rates compound over the first three months.
Why it matters: Understanding the math behind forecasts helps you set realistic assumptions. Monthly compounding creates larger changes than intuition suggests—10% monthly revenue growth doubles revenue in about 7 months, while 20% monthly growth doubles it in just under 4 months.
Use Cases for Founder's View
Fundraising Planning
Model different fundraising scenarios by editing Cash Infusion rows in forecast months. Add a $500K SAFE in Month 6 to see how it extends runway. Compare closing balances with and without the infusion to determine optimal fundraising timing.
Use conservative scenarios to show investors worst-case runway. Use optimistic scenarios to demonstrate best-case capital efficiency. Manual edits to revenue let you model specific growth milestones tied to the capital deployment.
Budget Planning
Review expense categories month-by-month to build departmental budgets. Edit Payroll in forecast months to model hiring plans—add $15K in Month 4 for two engineers, another $20K in Month 7 for sales hires. Edit Marketing expenses to model campaign investments.
Export the resulting forecast as a PDF to share with department heads, showing how their budget requests affect overall company runway and cash position.
Scenario Sensitivity Analysis
Run multiple scenarios to understand sensitivity to key assumptions. Start with Base Case, note the runway. Switch to Conservative, note the new runway. Switch to Optimistic, note that runway. The range between conservative and optimistic shows your uncertainty and helps quantify risk.
Create custom scenarios to model specific situations: "What if we cut expenses 5% but only grow revenue 2%?" or "What if we grow revenue 15% but expenses increase 8% due to scaling costs?"
Board Reporting
Export professional financials showing both historical performance and forward projections. Use the "Months of Actuals" slider to include the full quarter's results plus 6-12 months of forecast.
Include scenario comparisons in board materials—one PDF with base case, another with conservative assumptions. This demonstrates you've thought through different outcomes and have contingency plans.
Milestone Tracking
Mark specific revenue or cash balance milestones by creating custom scenarios that target those goals. If you need $50K MRR by end of year, work backward to determine the monthly growth rate required. Create a custom scenario with that rate and see if it's achievable given current expenses.
Edit specific forecast months to model the impact of product launches, major customer contracts, or seasonal variations on your ability to hit milestones.
Burn Rate Management
Monitor the Net Burn row and Runway metric to track cash consumption. If runway falls below 6 months in any scenario, use expense optimization scenarios to model cost cuts. Edit specific expense categories to see which reductions have the biggest impact on extending runway.
Compare Burn % of Revenue across months to identify whether burn is improving or worsening relative to revenue growth. Increasing burn percentages despite revenue growth suggest scaling inefficiency.
Tips for Effective Forecasting
Start with actuals: Your forecast is only as good as your historical data. Ensure transactions are properly categorized in Reconciliations before relying heavily on Founder's View projections.
Use scenarios for ranges: No forecast is perfectly accurate. Use Conservative, Base, and Optimistic scenarios to establish a range of outcomes. Plan for conservative, hope for base, celebrate optimistic.
Manual edits for known events: Use scenario assumptions for general trends, but manually edit forecast cells when you have specific knowledge—signed contracts, planned hires, scheduled marketing campaigns, known seasonal patterns.
Review cascade effects: When you edit a revenue or expense value, check how it affects closing balance, burn rate, and runway in that month and subsequent months. Large changes can have unexpected downstream effects.
Update regularly: Revisit your forecast monthly as new actuals come in. Your most recent actual becomes the foundation for projections, so outdated actuals produce inaccurate forecasts.
Conservative cash infusion assumptions: When modeling fundraising, don't add cash to forecast months until deals are signed. Use separate scenarios to show with/without financing rather than assuming capital will arrive.
Don't over-optimize expenses: Negative expense optimization rates model efficiency gains, but -5% monthly expense reduction over 12 months means cutting expenses in half. That's rarely realistic. Use modest rates (-1% to -2%) or manual edits for specific cuts.
Validate scenario assumptions: Compare your scenario growth rates to historical performance. If you've never grown revenue faster than 3% monthly, a 10% growth assumption in your forecast may be unrealistic.
Export before board meetings: Generate PDF exports the day before board meetings to ensure data is current. Last-minute transactions can affect projections.
Check metric trends: Don't just watch closing balance. Monitor Gross Profit %, Burn % of Revenue, and other metrics for early warning signs of deteriorating unit economics or scaling challenges.