

Revenue Dashboard
The Revenue Dashboard breaks down your revenue by source—subscriptions, onboarding fees, professional services, usage, affiliates, and partnerships. See which revenue streams are growing, which are declining, and where to focus your efforts.
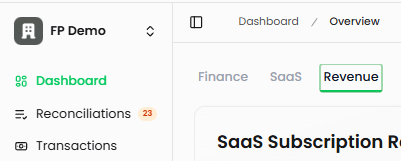
Accessing the Revenue Dashboard
Navigate to Dashboard in the left sidebar, then click the Revenue tab at the top. The dashboard displays revenue from your connected Stripe account and Futureproof general ledger.
What's On the Revenue Dashboard
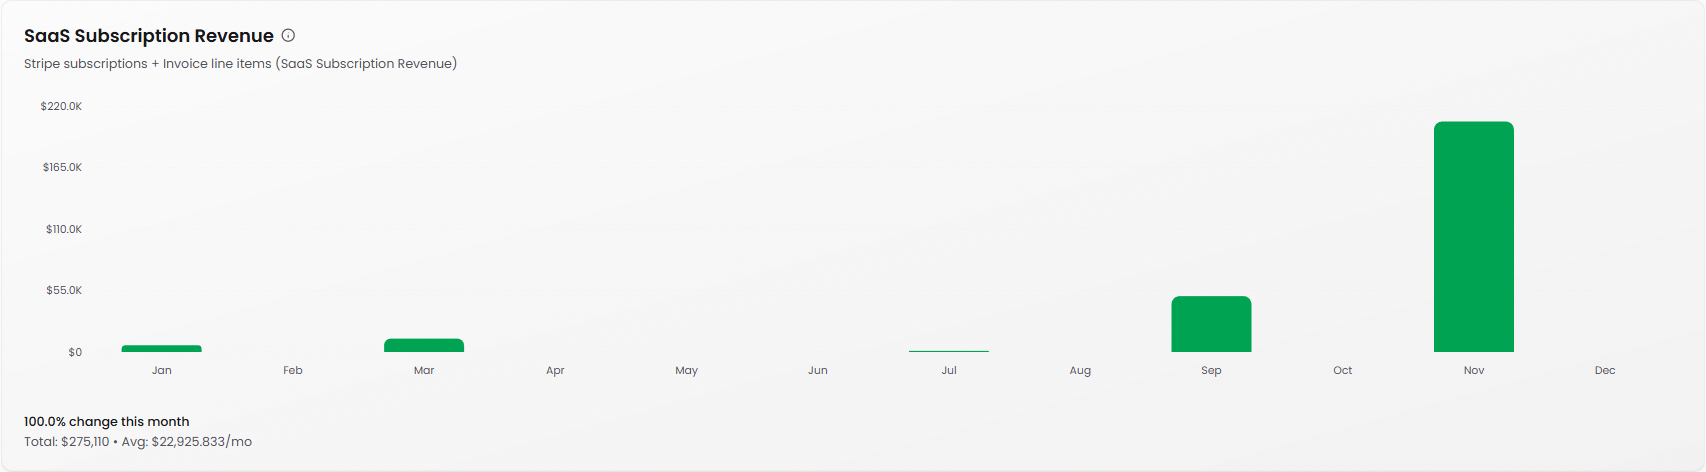
SaaS Subscription Revenue
Your core recurring revenue from subscription-based services.
What it shows: Monthly recurring revenue from Stripe subscriptions. This combines Stripe subscription payments with invoice line items marked as "SaaS Subscription Revenue."
Formula: Total recurring revenue from subscription-based services, representing your MRR
Trend indicator: Shows month-over-month percentage change and direction (e.g., "100.0% change this month")
Total and average: Displays total revenue (e.g., "$275,110") and average monthly revenue (e.g., "Avg: $22,925.833/mo")
Why it matters: This is the lifeblood of a SaaS business. Tracking MRR helps you gauge the health of your subscription model and forecast future revenue. Consistent growth here means your core product is gaining traction.
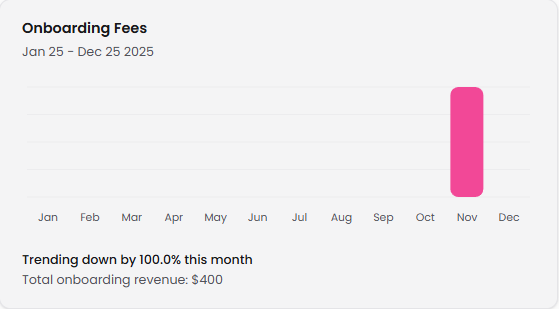
Onboarding Fees
One-time revenue from customer onboarding and implementation.
What it shows: Non-recurring fees charged for setting up new customers
Trend indicator: Shows percentage change from previous month (e.g., "Trending down by 100.0% this month")
Total: Cumulative onboarding revenue (e.g., "Total onboarding revenue: $400")
Why it matters: Onboarding fees help offset customer acquisition costs. A spike in onboarding revenue typically precedes an increase in subscription revenue. If this number is trending down, it may indicate fewer new customers coming through the pipeline.
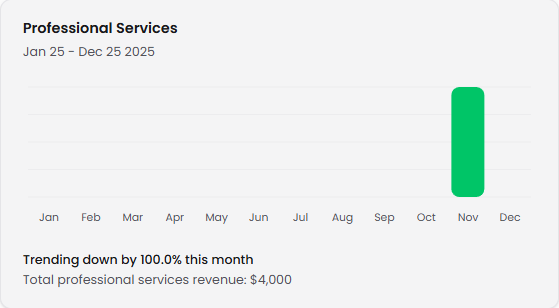
Professional Services
Revenue from consulting, implementation, and custom development work.
What it shows: Income from services beyond your core product—think custom integrations, training, or consulting
Trend indicator: Displays month-over-month percentage change
Total: Cumulative professional services revenue (e.g., "Total professional services revenue: $4,000")
Why it matters: High professional services revenue can indicate strong customer engagement or successful expansion efforts. However, too much services revenue relative to subscriptions might suggest your product needs more self-service capabilities or that you're selling to customers who need extensive customization.
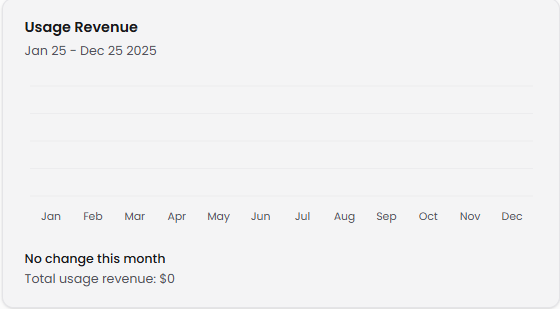
Usage Revenue
Variable revenue based on customer consumption or usage metrics.
What it shows: Revenue from usage-based pricing models (e.g., API calls, storage, transactions, seats)
Trend indicator: Shows change status (e.g., "No change this month")
Total: Cumulative usage-based revenue
Why it matters: Usage revenue often scales with customer value. When customers use your product more, they pay more—aligning pricing with delivered value. This metric helps you understand whether customers are expanding their usage over time.
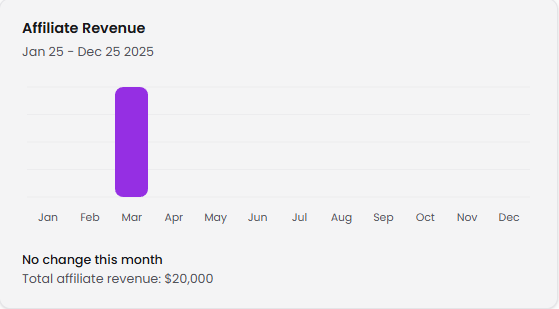
Affiliate Revenue
Commissions and referral income from partner programs.
What it shows: Revenue earned through affiliate partnerships, referral programs, or reseller arrangements
Trend indicator: Displays monthly change status
Total: Cumulative affiliate revenue (e.g., "Total affiliate revenue: $20,000")
Why it matters: Affiliate revenue represents additional distribution channels. If this is growing, your partner ecosystem is working. If it's stagnant, you might need to invest more in partner enablement or commission structures.
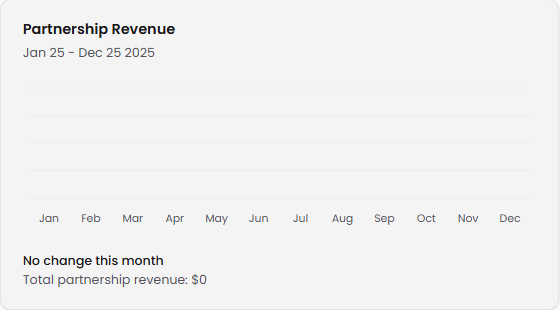
Partnership Revenue
Income from strategic partnerships, co-selling arrangements, or revenue-sharing agreements.
What it shows: Revenue generated through formal partnership agreements—distinct from affiliate relationships
Trend indicator: Shows monthly change status
Total: Cumulative partnership revenue
Why it matters: Partnership revenue can unlock new markets and customer segments without heavy marketing spend. Strong partnership revenue suggests your go-to-market strategy is diversified beyond direct sales.
Understanding Your Revenue Mix
Revenue composition tells your story: While subscription revenue should be your foundation, complementary streams help stabilize cash flow and expand customer value. Your revenue mix determines whether you're building a scalable SaaS business or a services company.
Leading indicators matter: Onboarding fees and professional services revenue often precede subscription growth. A spike in onboarding this month typically translates to higher MRR next month as those customers start paying subscription fees.
Watch the services ratio: If professional services revenue consistently exceeds subscription revenue, your business may operate more like a consultancy than a scalable SaaS company. This affects valuation and growth potential.
Predictability drives value: Subscription and usage revenue are more predictable than one-time fees. The more your revenue mix shifts toward recurring streams, the easier it becomes to forecast and plan.
Tips for Using the Revenue Dashboard
Monitor composition weekly: Revenue mix changes over time. Weekly reviews help you understand whether you're building a subscription business or a services business—and adjust accordingly.
Correlate with customer activity: When onboarding revenue increases, check your new customer pipeline. When usage revenue grows, identify which customers are expanding and why.
Set targets for each stream: Don't just track total revenue. Set specific targets for subscription growth, usage expansion, and one-time fee optimization.
Look for leading indicators: Professional services and onboarding spikes often predict subscription growth in the following months. Use these signals to forecast more accurately.
Connect to other dashboards: Revenue data becomes more powerful when combined with SaaS metrics. Cross-reference subscription revenue with ARR growth and churn rate from the SaaS Dashboard.