

Finance Dashboard
The Finance Dashboard gives you a real-time view of your company's financial health. It's designed to help you monitor cash flow, track expenses, and identify trends at a glance.
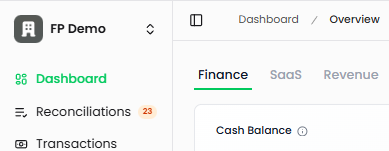
Accessing the Finance Dashboard
Navigate to Dashboard in the left sidebar, then select the Finance tab at the top of the page. This is the default view when you open your dashboard.
Dashboard Widgets
Cash Balance
Your current cash position across all connected bank accounts.
What it shows: Sum of all checking, savings, and treasury account balances. Includes cash-equivalent investment accounts. Updates automatically when accounts are synced.
Last Synced: Displays the most recent sync time with your connected accounts
Why it matters: This is your operating capital—the money available to run your business day-to-day

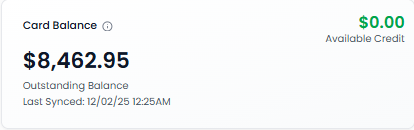
Card Balance
Summary of your business credit card position.
Outstanding Balance: Total amount currently owed across all connected credit cards. Available Credit: remaining credit limit across all cards.
Available Credit: Remaining credit limit across all cards
Last Synced: Most recent update from your credit card accounts
Why it matters: Helps you manage credit utilization and avoid hitting credit limits
Net Cash Burn
The average monthly difference between your cash outflows and inflows.
Calculation: Average Monthly (Cash Out - Cash In). Calculated as the average difference between your monthly cash outflows and inflows. A positive number indicates you're spending more than earning (burning cash). A negative number means you have positive cash flow.
Positive number: You're burning cash (spending more than earning)
Negative number: You have positive cash flow (earning more than spending)
Runway Remaining: How long your current cash balance will last at the current burn rate
Shows "∞ Unlimited" when you have positive cash flow
Why it matters: Critical for understanding how long you can operate before needing additional funding

Reconciliations
Quick view of transactions waiting to be categorized.
What it shows: Number of transactions waiting to be categorized. AI automatically categorizes these transactions, which you can review and approve in the Reconciliations page.
Status: Good (Green <25) • Yellow (25-75) • Red (>75)
Action: Click the widget to go directly to the Reconciliations page
Why it matters: Uncategorized transactions affect the accuracy of your financial reports. The AI automatically categorizes most transactions, but some require human review

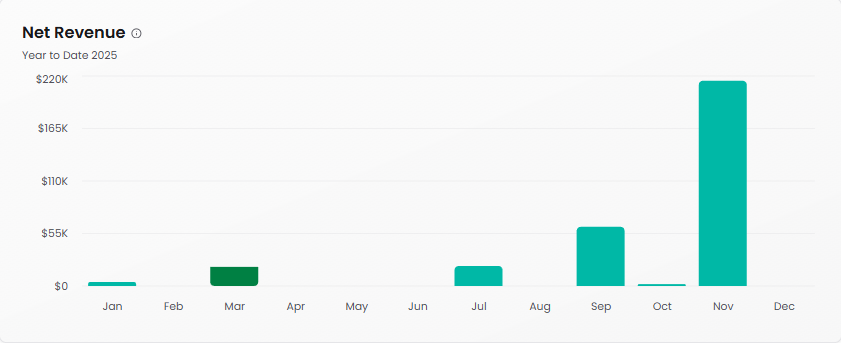
Net Revenue
Year-to-date revenue tracking showing monthly trends.
What it shows: Shows operating revenue from core business activities (subscriptions, services, sales). Excludes non-operating income (interest, FX gains) and contra revenue (discounts, returns). Only displays categories with actual transactions. Accounts for deferred revenue schedules. Uses accrual accounting (revenue recognized when invoiced). Calendar year-to-date.
Time period: Current year to date
Why it matters: Track revenue growth patterns and identify seasonal trends in your business
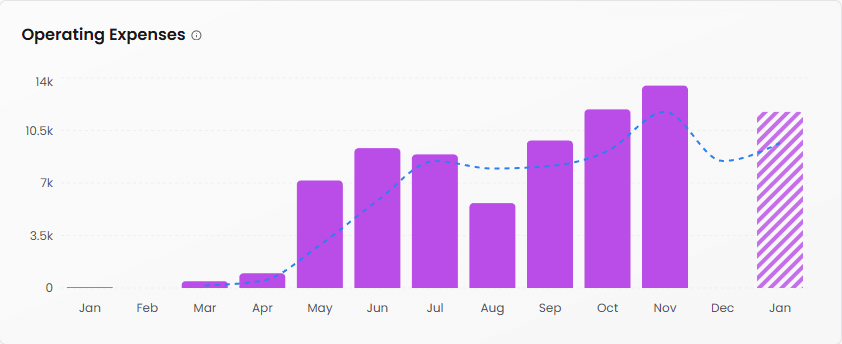
Operating Expenses
Monthly operating expense tracking with trend analysis.
What it shows: Your monthly operating expenses with a trend line. Shows your total business expenses for each month. The striped bar indicates projected expenses for the upcoming month. The dashed line shows the 3-month moving average trend.
Projection: The patterned bar (typically the current or future month) shows projected expenses based on historical trends
Dotted line: Trend indicator showing whether expenses are increasing or decreasing
Why it matters: Spot unusual spending patterns and keep expenses under control
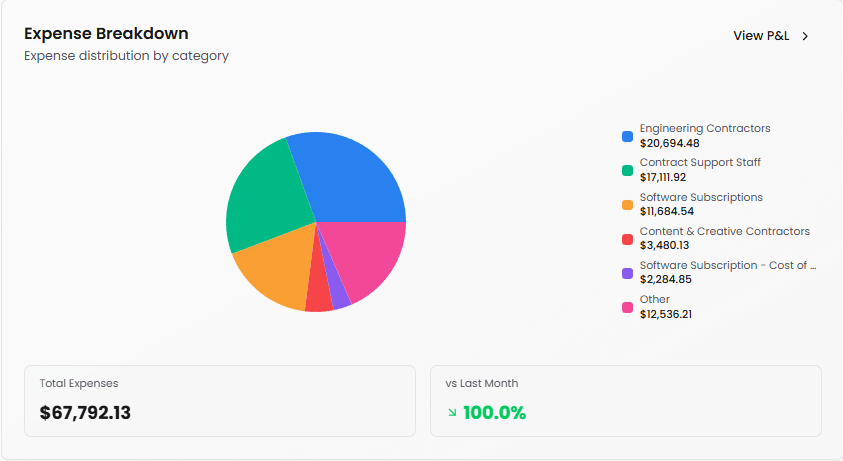
Expense Breakdown
Visual breakdown of where your money goes.
What it shows: Expense distribution by category (pie chart)
View P&L: Click to see your detailed Profit & Loss statement
Why it matters: Quickly identify your largest expense categories and spot opportunities to optimize spending
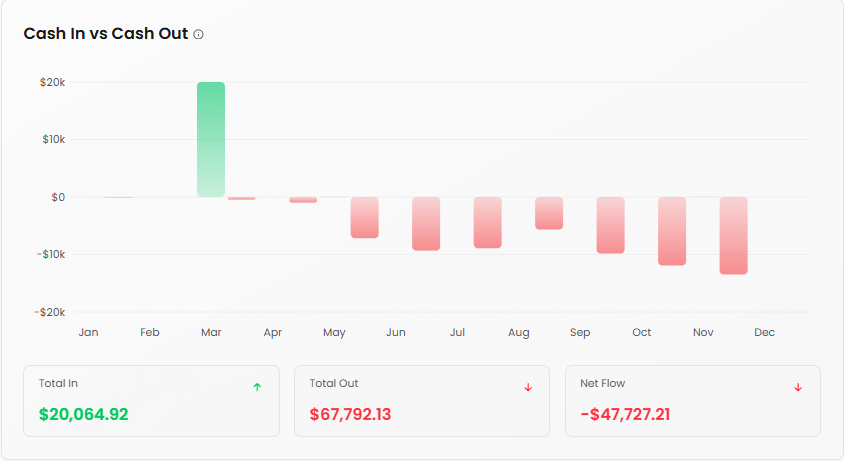
Cash In vs Cash Out
Compare monthly cash inflows and outflows side by side.
What it shows: Visualizes your cash inflows (green bars) versus outflows (red bars) for each month. Positive net flow means more money coming in than going out.
Green bars: Cash coming in
Red bars: Cash going out
Toggle: Enable "Show Net Cash Flow" to overlay the net difference
Why it matters: Visualize cash flow patterns and identify months with cash crunches
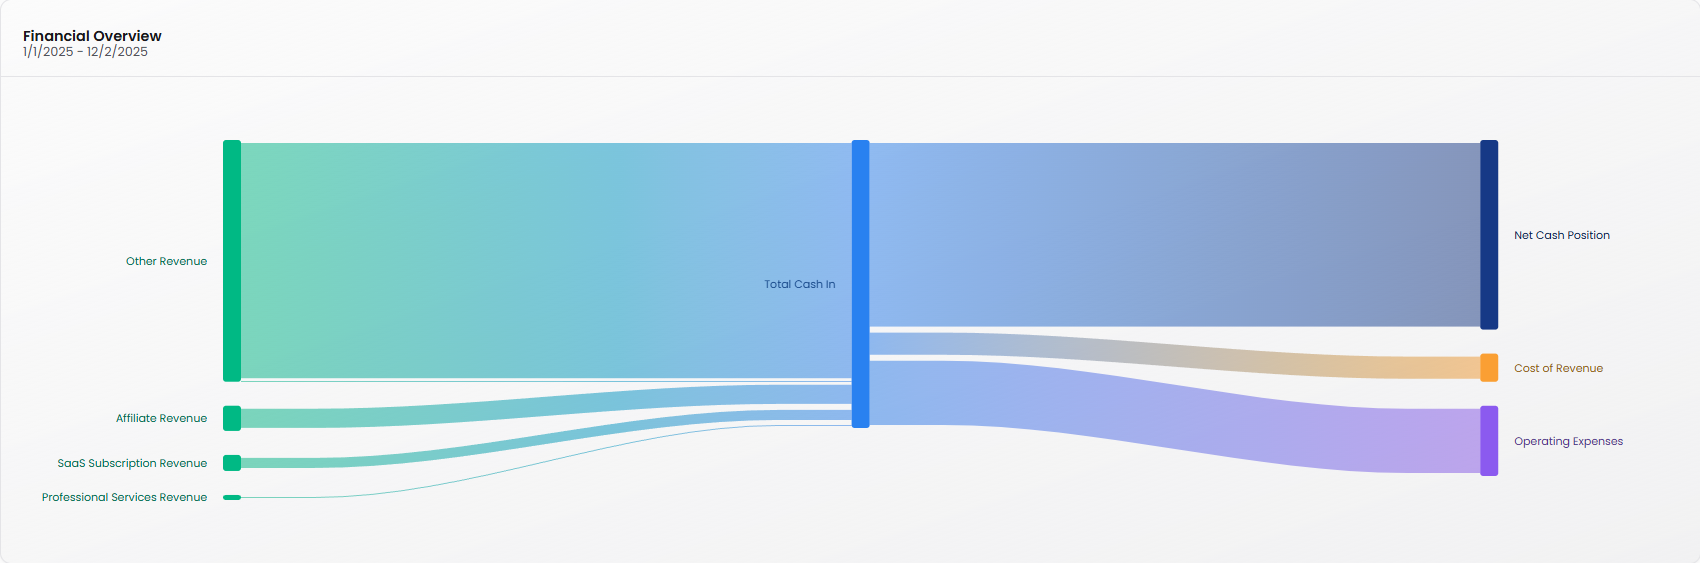
Financial Overview
High-level comparison of revenue sources and expense categories.
Time period: Displays date range (e.g., 1/1/2025 - 11/24/2025)
Categories shown:
Total Cash In (blue)
Cost of Revenue (orange)
Operating Expenses (purple)
Onboarding Fees (teal)
Partnership Revenue (green)
Why it matters: Compare the relative size of revenue streams and major expense categories at a glance
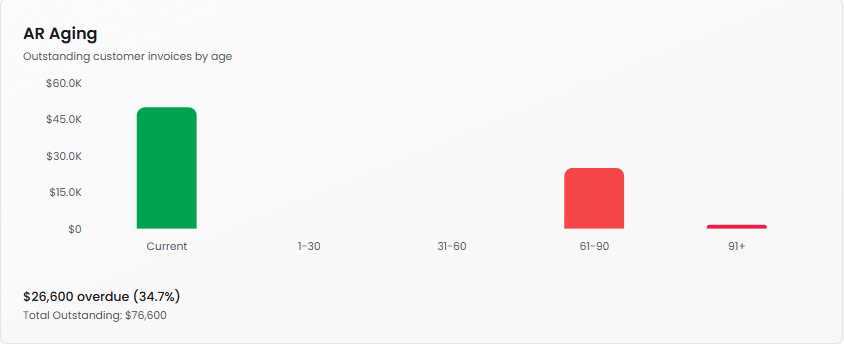
AR Aging
Outstanding customer invoices by age.
What it shows: Outstanding customer invoices by age
Age categories: Current (green), 1-30, 31-60, 61-90 (red), 91+ (red)
Summary: Shows total overdue amount and percentage of total outstanding (e.g., "$26,600 overdue (34.7%)" with "Total Outstanding $76,600")
Why it matters: Monitor which customers owe you money and how long invoices have been outstanding. This helps you manage cash flow and identify collection issues
AP Aging
Outstanding vendor bills by age.
What it shows: Outstanding vendor bills by age
Age categories: Current, 1-30, 31-60, 61-90, 91+
Status: Displays "No outstanding bills" when all bills are paid
Why it matters: Track what you owe to vendors and when payments are due. Helps maintain good vendor relationships and plan for cash outflows

Tips for Using the Finance Dashboard
Review frequency: Check daily or weekly to stay on top of your financial position. The dashboard syncs automatically with your connected accounts.
Watch your burn: If your Net Cash Burn is positive and your runway is decreasing, consider either reducing expenses or accelerating revenue growth.
Reconcile regularly: Don't let the transaction queue build up. Regular reconciliation keeps your financial data accurate and audit-ready.
Spot trends early: Use the trend lines in Operating Expenses and the monthly patterns in Cash In vs Cash Out to anticipate problems before they become critical.