

SaaS Dashboard
The SaaS Dashboard tracks the metrics that matter most for subscription businesses. Monitor recurring revenue, customer lifetime value, retention, and growth trends all in one place.
Accessing the SaaS Dashboard
Navigate to Dashboard in the left sidebar, then select the SaaS tab at the top of the page.
Dashboard Widgets
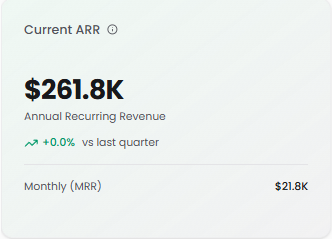
Current ARR
Your total Annual Recurring Revenue normalized to a one-year period.
What it shows: Total value of recurring revenue normalized to a one-year period
Calculated from: Active subscription contracts and recurring invoices
Percentage change: Compares current ARR to the end of last quarter
Monthly (MRR): Your Monthly Recurring Revenue
Why it matters: ARR is the primary growth metric for SaaS businesses. Track this to understand your recurring revenue baseline.
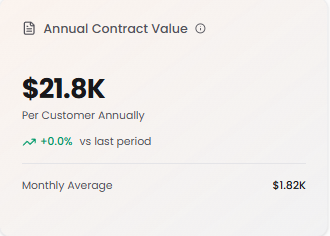
Annual Contract Value (ACV)
Average annual revenue per customer contract.
What it shows: Per customer annually
Calculation: Total ARR ÷ Number of Active Customers
Percentage change: Compared to the last period
Monthly Average: ACV divided by 12
Why it matters: Higher ACV often means more valuable customers and better unit economics. Track changes to understand if you're moving upmarket or downmarket.
Lifetime Value (LTV)
Total revenue expected from a customer over their entire relationship with your business.
What it shows: Average revenue per customer
Calculation: Average Revenue Per Customer × Average Customer Lifespan
Display: Shows the calculated LTV with the average revenue per customer below
Why it matters: Understanding LTV helps you determine how much you can afford to spend on customer acquisition while maintaining profitability.

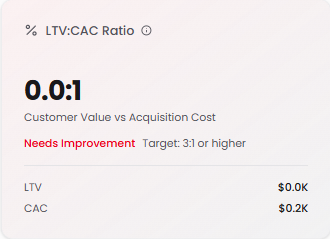
LTV:CAC Ratio
Measures the relationship between customer lifetime value and acquisition cost.
What it shows: Customer Value vs Acquisition Cost
Calculation: LTV ÷ CAC
Benchmarks:
3:1 or higher = Excellent (shown in green)
1:1 to 3:1 = Acceptable (shown in yellow/orange)
Below 1:1 = Needs Improvement (shown in red)
Display: Shows both LTV and CAC values for transparency
Why it matters: This ratio tells you if your customer acquisition strategy is sustainable. A ratio of 3:1 means every dollar spent on acquisition returns three dollars in customer value.
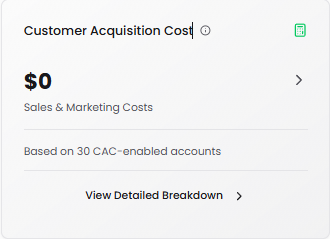
Customer Acquisition Cost (CAC)
Total Sales & Marketing costs required to acquire a new customer.
What it shows: Cost per customer acquisition
How CAC is calculated: Total Sales & Marketing costs for the current period ÷ Number of new customers acquired
Based on: Accounts with CAC enabled (accounts categorized for S&M cost tracking)
View Detailed Breakdown: Click to see:
Total CAC Spend
Number of Transactions
Average Transaction amount
Breakdown by Category, Account, or Top Transactions
Export capability for deeper analysis
Why it matters: Lower CAC means more efficient growth. Compare this against LTV to ensure profitable customer acquisition.
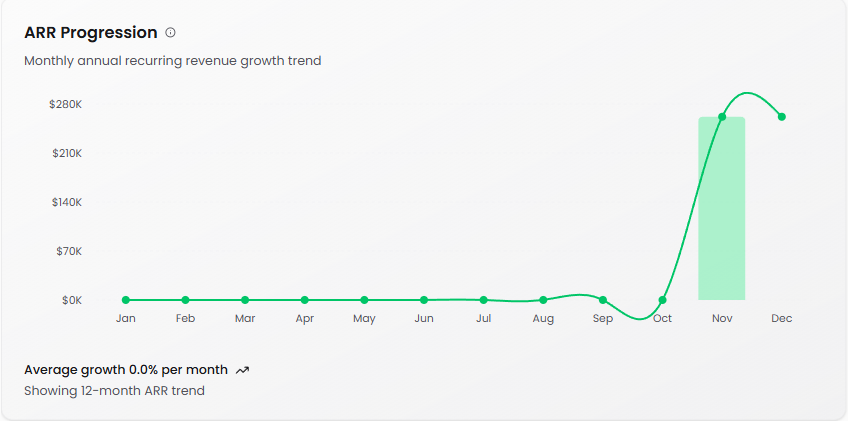
ARR Progression
Monthly annual recurring revenue growth trend over time.
What it shows: ARR Growth Visualization showing total ARR (line) and new ARR added (bars) over time
Bars: New ARR added each month
Line: Total cumulative ARR
Average growth: Percentage growth per month
Purpose: Helps identify growth patterns and seasonal trends
Why it matters: Consistent ARR growth indicates healthy business momentum. Use this to spot acceleration or deceleration in your growth rate.
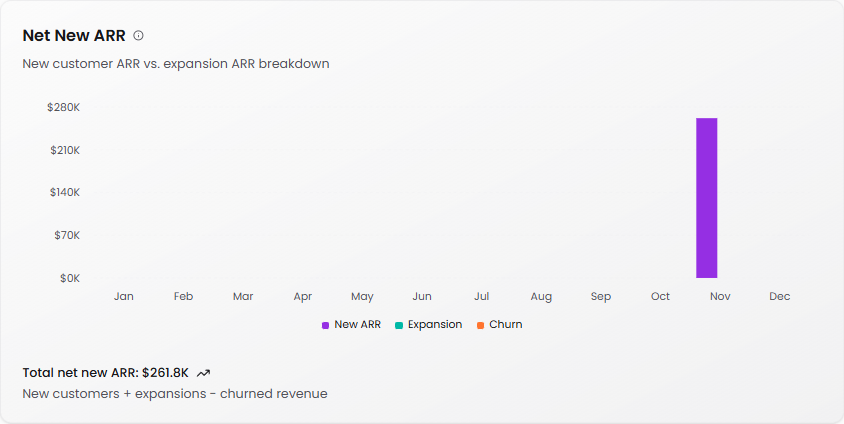
Net New ARR
Visualizes ARR changes from new customers, expansions, and churn.
What it shows: Breakdown of monthly ARR changes
Components:
New ARR (purple): Revenue from newly acquired customers
Expansion (teal): Additional revenue from existing customers (upgrades, add-ons)
Churn (orange): Lost revenue from canceled customers
Formula: New ARR + Expansion ARR - Churned ARR
Total net new ARR: Sum displayed at the bottom
Why it matters: Understanding the composition of your growth helps you prioritize initiatives. If most growth comes from new customers, focus on acquisition. If expansion is strong, invest in customer success and upselling.
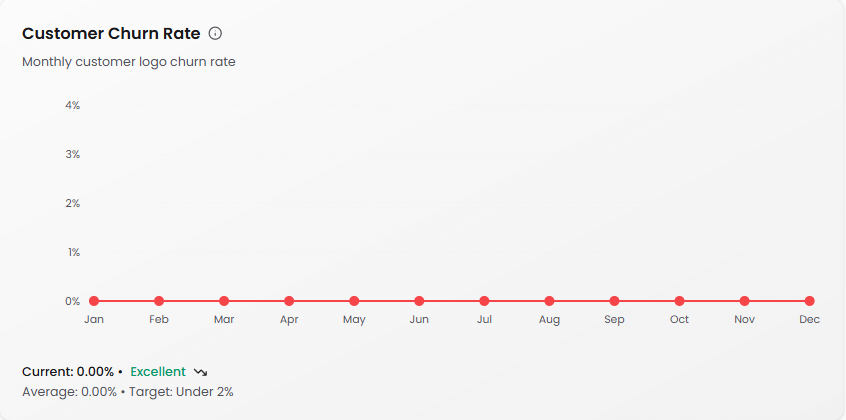
Customer Churn Rate
The percentage of customers who canceled during a month.
What it shows: Monthly customer logo churn rate
Formula: (Customers Who Canceled ÷ Customers at Start of Month) × 100
Calculated: Independently for each period
Benchmarks (Monthly):
Enterprise: <0.5% Excellent, <1% Acceptable
Mid-Market: <1% Excellent, 1-2.5% Acceptable
SMB: <3% Excellent, 3-7% Acceptable
Display: Current rate, average rate, and target
Status indicator: Shows "Excellent" (green), "Acceptable" (yellow), or "Needs Improvement" (red)
Why it matters: High churn erodes growth. Track this closely to identify retention issues before they become critical.
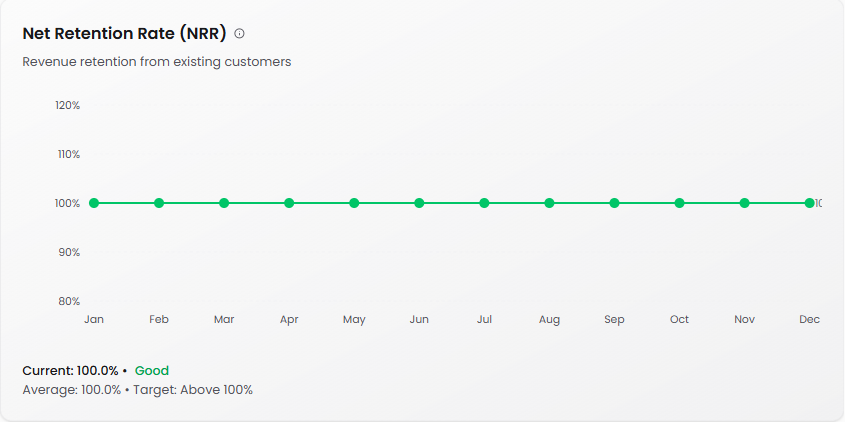
Net Retention Rate (NRR)
Measures revenue retained from existing customers including expansions and contractions.
What it shows: Revenue retention from your existing customer base
Formula: (Starting ARR + Expansion - Contraction - Churn) ÷ Starting ARR × 100
Interpretation:
Above 100% = Net growth from existing customers (ideal)
90-100% = Good retention
Below 90% = Revenue leakage (action needed)
Display: Current rate, average rate, and target (Above 100%)
Status indicator: Shows "Good" (green) or other status based on performance
Why it matters: NRR above 100% means you can grow without adding new customers. This is the holy grail of SaaS metrics—your existing customers are expanding their spend faster than others are churning.
Understanding Your SaaS Metrics
The relationship between metrics: Your SaaS metrics tell a story when viewed together. Strong ARR growth with high churn might indicate an acquisition problem. High CAC with low LTV suggests you're overpaying for customers who don't stick around.
Focus on unit economics: The LTV:CAC ratio is your profitability compass. If it's below 3:1, either reduce acquisition costs or increase customer value through retention and expansion.
Retention is revenue: NRR above 100% is transformative. It means your business can grow from its existing base while new customer acquisition becomes pure upside.
Churn benchmarks vary: Enterprise businesses should target sub-0.5% monthly churn, while SMB businesses may see 3-7% and still be healthy. Know your segment's benchmarks.
Tips for Using the SaaS Dashboard
Review weekly: SaaS metrics compound quickly. Weekly reviews help you spot trends before they become problems.
Connect the dots: Look at metrics together. For example, rising CAC with flat ACV means your customer acquisition efficiency is declining.
Set clear targets: Use the benchmark indicators (Excellent, Acceptable, Needs Improvement) to guide your team's focus.
Track the CAC breakdown: Click into the detailed breakdown regularly to understand which marketing and sales activities drive the best returns.
Watch Net New ARR composition: If new customer ARR is declining while churn stays constant, your growth is slowing. If expansion ARR is growing, your customer success efforts are working.