

Investor View
The Investor View provides AI-powered financial analysis and reporting designed for board meetings, investor updates, and fundraising conversations. View key performance metrics at a glance, examine detailed financial trends across multiple periods, and generate comprehensive investor reports that highlight risks, opportunities, and strategic recommendations.
Accessing Investor View
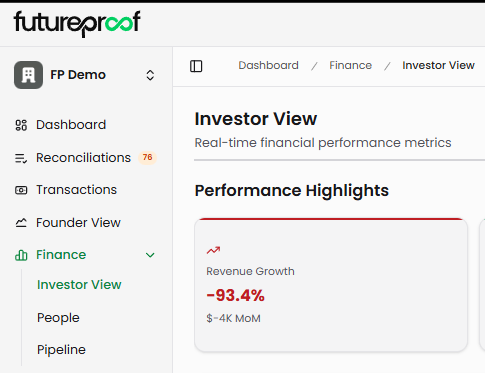
Navigate to Finance in the left sidebar, then select Investor View from the submenu. The page displays performance highlights, detailed financial metrics, and report generation tools.
Page Layout
Performance Highlights
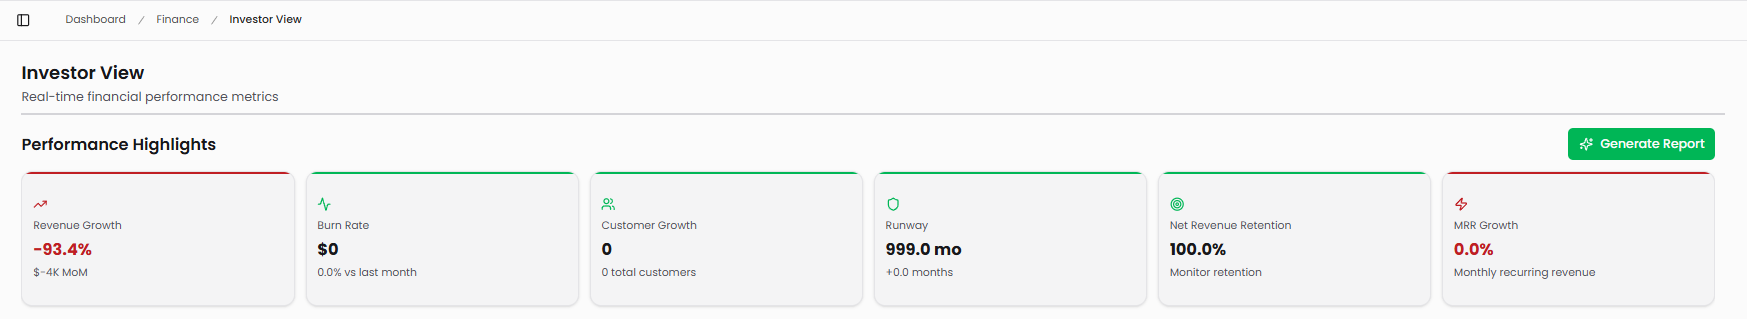
The top section displays six key metric cards that summarize your company's financial health. These cards provide the high-level metrics investors typically want to see first during updates or board presentations.
Revenue Growth shows your period-over-period revenue change as a percentage. A red downward arrow indicates declining revenue, while a green upward arrow shows growth. The subtitle displays the dollar change month-over-month (e.g., "$-4K MoM").
Burn Rate displays your current monthly cash burn. This shows as $0 when you have positive cash flow or the dollar amount you're burning monthly. The subtitle indicates the percentage change versus the last month (e.g., "0.0% vs last month").
Customer Growth tracks your total customer count. The main number shows current customers, while the subtitle displays "0 total customers" for context.
Runway calculates how many months your current cash balance will last at the current burn rate. This shows as "999.0 mo" when you have positive cash flow (essentially unlimited runway) or the actual month count when burning cash. The subtitle provides additional context like "+0.0 months" to show runway change.
Net Revenue Retention measures revenue retention from your existing customer base including expansions and contractions. The percentage shows whether you're growing revenue from current customers (above 100%) or experiencing net contraction (below 100%). The subtitle reminds you this metric tracks "Monitor retention."
MRR Growth displays your monthly recurring revenue growth rate. The percentage shows how much your MRR increased or decreased, with the subtitle clarifying this represents "Monthly recurring revenue."
Why it matters: These six metrics provide the executive summary investors need. Strong revenue growth with controlled burn and high NRR signals healthy unit economics. Unlimited runway with positive cash flow indicates you've reached profitability. Declining revenue with high burn and shrinking runway signals urgent need for action.
Generate Report
The green "Generate Report" button in the top right triggers AI-powered analysis of your financial data. Click this button to create a comprehensive Investor Analysis Report that synthesizes your metrics into actionable insights.
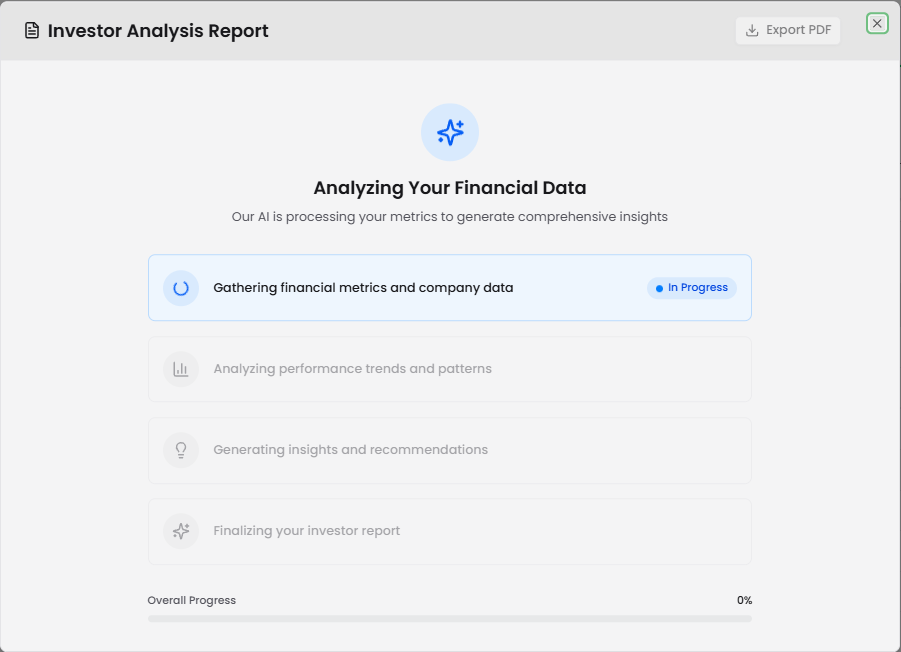
The generation process takes less than one minute. During generation, a progress modal displays showing four stages: gathering financial metrics and company data, analyzing performance trends and patterns, generating insights and recommendations, and finalizing your investor report. A progress bar shows completion percentage, and each stage displays an "In Progress" badge as it works.
Once complete, the full report appears in a modal with several sections organized for investor consumption. The report can be exported as a PDF for sharing with board members, investors, or advisors.
Why it matters: AI-generated reports save hours of manual analysis and report preparation. Instead of compiling metrics and crafting narratives yourself, the system analyzes your data and generates professional reports highlighting the most important insights, risks, and opportunities for investors.
Investor Analysis Report Structure
Financial Performance Report Header
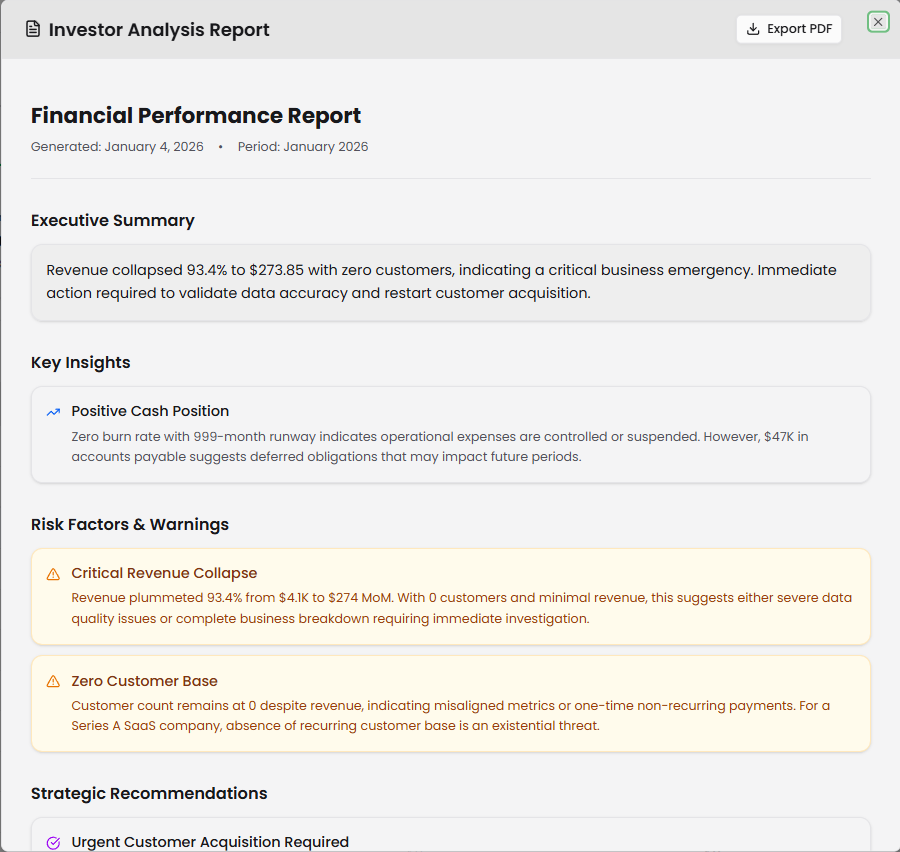
The report opens with a header showing the report title "Financial Performance Report," the generation date (e.g., "Generated: January 2, 2026"), and the reporting period (e.g., "Period: January 2026"). An "Export PDF" button in the top right lets you download the complete report.
Executive Summary
This section provides the highest-level overview of your financial situation. The AI identifies critical business continuity issues, major operational changes, or significant financial anomalies. For example, if revenue dropped to $0 with zero customers and zero expenses, the summary flags this as either a complete operational shutdown or critical data reporting failure requiring immediate investigation.
Why it matters: The executive summary gives investors or board members the critical takeaway within seconds. If there's an emergency, they know immediately. If things are healthy, they understand that at a glance before diving into details.
Key Insights
This section breaks down into specific subsections analyzing different aspects of your business.
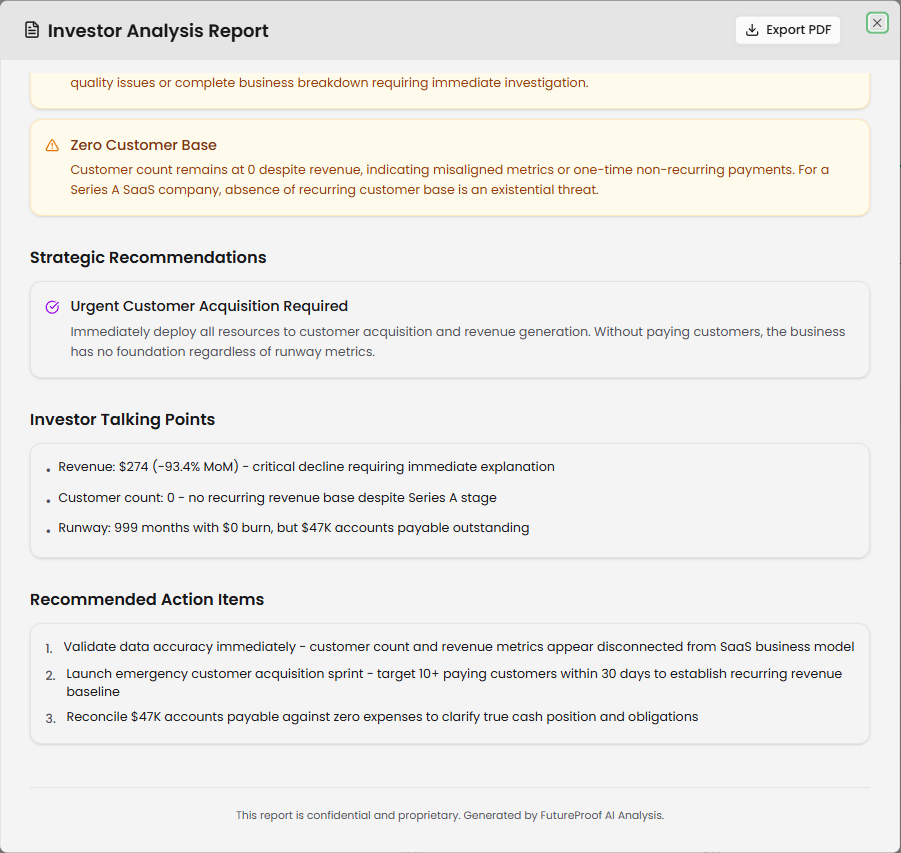
Risk Factors & Warnings highlights issues requiring attention. Each risk appears in a yellow-highlighted box with a warning icon. For example, "Business Operations Halted" might describe a complete revenue collapse with supporting evidence like revenue dropping from $4,138 to $0 (100% decline) with zero customers and zero expenses in a period. Another risk like "Unexplained December Activity" might flag anomalies such as revenue appearing with 0 customers and minimal expenses, suggesting one-time events, data corrections, or accounting anomalies rather than recurring SaaS revenue.
Why it matters: Investors need to understand risks immediately. This section surfaces red flags proactively so you can address them during investor conversations rather than being asked difficult questions without preparation.
Strategic Recommendations provides actionable guidance based on your metrics. Each recommendation appears in a purple-highlighted box with a checkmark icon. For example, "Immediate Action Required" might recommend conducting an emergency assessment of business status, validating financial data integrity, and determining if operations continue. The AI provides specific context like noting $47K in accounts payable with no revenue or expenses, clarifying cash position and funding needs immediately.
Why it matters: Recommendations translate data into decisions. Instead of just seeing problems, you get specific actions to take, making the report immediately actionable for board discussions or strategic planning.
Investor Talking Points
This section provides bulleted highlights formatted for verbal presentation or written updates. Points might include items like "Revenue: $0 in January (down 100% from $4,138 in December)," "Customer count: 0 across both periods with no active operations," and "Cash position unclear: $47K accounts payable with no revenue or expenses reported."
Why it matters: Talking points give you ready-made content for investor emails, board presentations, or pitch decks. Copy these directly into your materials or use them as the foundation for your narrative.
Recommended Action Items
The final section lists specific numbered action items. For example: "1. Conduct immediate audit of financial reporting systems to validate data accuracy," "2. Provide detailed explanation of December revenue source and January operational status," and "3. Present updated cash position, funding requirements, and business continuity plan to investors within 48 hours."
Why it matters: Action items create accountability and next steps. Share these with your team to coordinate responses, or reference them in board meetings to show you have a plan.
Detailed Financial Metrics
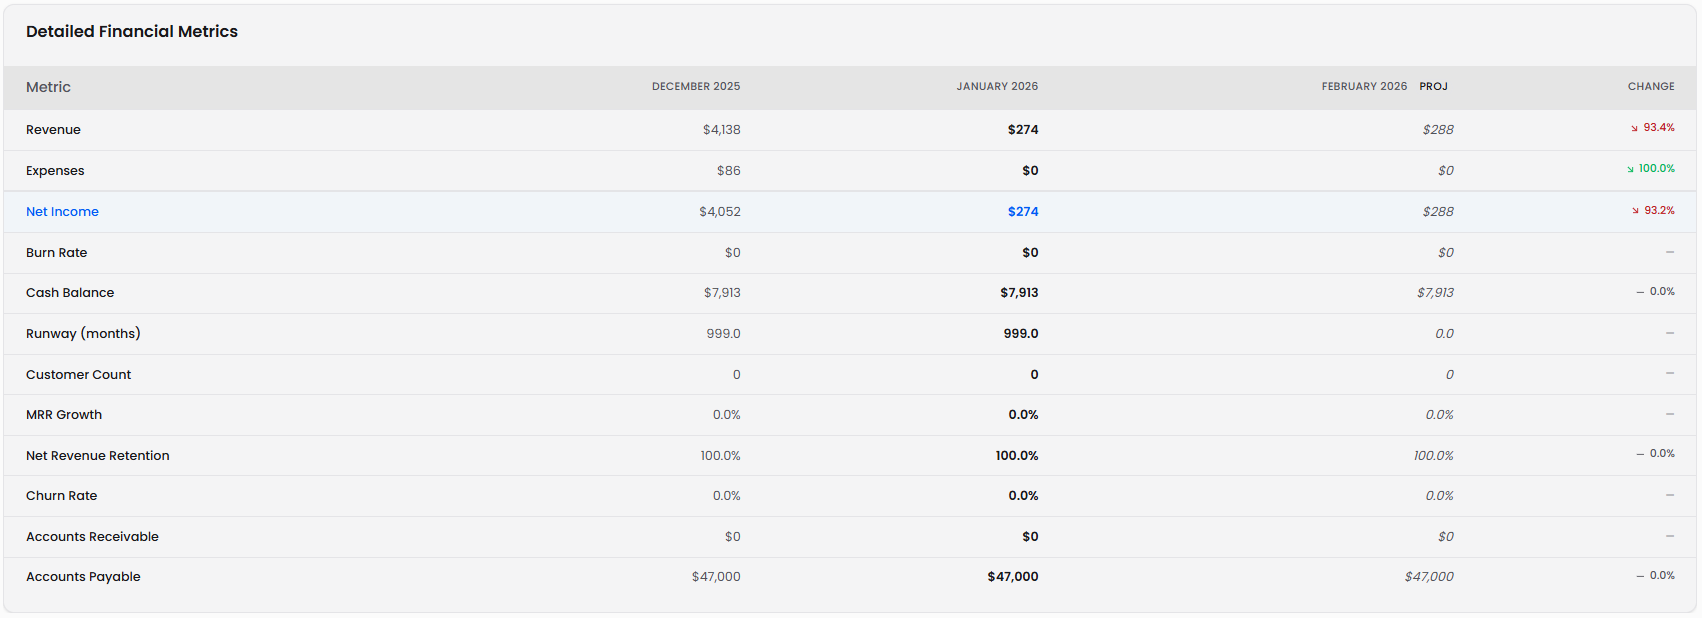
Below the performance highlights, the Detailed Financial Metrics table displays comprehensive financial data across multiple time periods. The table shows three months by default: two months of actual historical data and one month of projected data.
Each row represents a specific financial metric, and each column represents a time period. Historical months show actual values from your transactions, while projected months (labeled "PROJ") display forecasted values. A "CHANGE" column on the right shows the percentage change between the most recent historical month and the previous month, color-coded red for negative changes and green for positive changes.
Metric Rows
Revenue displays your total revenue for each period. Historical months show actual revenue from transactions and Stripe data. The projected month forecasts revenue based on recent trends.
Expenses shows total expenses for each period. Historical data comes from categorized transactions, while projections estimate future spending.
Net Income calculates Revenue minus Expenses for each period. This row appears in blue, indicating it's a calculated metric derived from other rows. Positive net income (green) indicates profitability, while negative net income means you're operating at a loss.
Burn Rate displays your monthly cash consumption rate. $0 indicates break-even or positive cash flow, while positive numbers show how much cash you're burning monthly.
Cash Balance shows your total cash position at the end of each period. This reflects your actual bank account balances from connected accounts for historical months and projected balances based on revenue, expenses, and burn rate for future months.
Runway (months) calculates how many months your current cash balance will last at the current burn rate. The value shows 999.0 when you have positive cash flow (essentially unlimited runway) or the calculated month count when burning cash. Projected months show how runway evolves based on forecasted burn.
Customer Count displays the total number of active customers for each period. This metric tracks customer growth or contraction over time.
MRR Growth shows your monthly recurring revenue growth rate as a percentage. 0.0% indicates flat MRR, while positive percentages show growth and negative percentages indicate contraction.
Net Revenue Retention measures revenue retained from existing customers including expansions and contractions. 100.0% means you retained all revenue from existing customers without any growth or loss. Above 100% indicates net expansion, below 100% indicates net contraction.
Churn Rate displays the percentage of customers who canceled during the period. 0.0% indicates no churn (perfect retention), while higher percentages show customer loss rates.
Accounts Receivable shows outstanding customer invoices not yet collected. $0 indicates no outstanding receivables, while positive values show money owed to you by customers.
Accounts Payable displays outstanding vendor bills not yet paid. $0 means all bills are current, while positive values show money you owe to vendors.
Why it matters: The detailed metrics table provides the complete financial story behind the summary cards. Investors examining your financials will want to see trends across periods, not just single-month snapshots. Comparing actual performance across historical months validates whether your business is improving or deteriorating, while projected months show where you're headed based on current trajectories.
Export PDF
The "Export PDF" button at the top of the report modal downloads the complete Investor Analysis Report as a PDF file. The export includes all sections: Executive Summary, Key Insights, Risk Factors & Warnings, Strategic Recommendations, Investor Talking Points, and Recommended Action Items.
The detailed financial metrics table is not included in the PDF export. The report focuses on narrative insights and strategic guidance rather than raw data tables.
Why it matters: PDF exports enable you to share professional financial analysis with investors, board members, or advisors without giving them direct access to your Futureproof account. Create reports before board meetings, include them in investor update emails, or attach them to fundraising materials.
Understanding the AI Analysis
The Investor Analysis Report uses AI to examine your financial metrics and identify patterns, risks, and opportunities. The system analyzes all metrics in the detailed financial metrics table including revenue trends, expense patterns, cash position, customer growth, retention rates, and accounts payable/receivable status.
The AI looks for anomalies like sudden revenue drops, unexplained customer count changes, burn rate acceleration, or unusual expense patterns. It also evaluates standard SaaS health metrics like MRR growth, net revenue retention, and churn rate against industry benchmarks.
Based on this analysis, the AI generates insights tailored to your specific financial situation. If you're burning cash with limited runway, the report emphasizes runway extension strategies. If revenue is growing with high retention, it highlights positive momentum for investor conversations. If data appears inconsistent or anomalous, it flags potential reporting issues.
Why it matters: AI analysis provides an objective third-party perspective on your financials. It catches issues you might overlook and surfaces insights that take hours to identify manually. The system essentially acts as a financial analyst reviewing your data and preparing investor-ready commentary.
Use Cases for Investor View
Board Meeting Preparation
Generate an Investor Analysis Report before each board meeting. Review the Risk Factors & Warnings section to prepare explanations for any issues. Use the Strategic Recommendations as discussion topics for board guidance. Share the PDF with board members 24-48 hours before meetings so they arrive informed.
Investor Update Emails
Create monthly or quarterly investor updates using the Talking Points section as your foundation. Copy the key metrics and insights directly into email templates. Attach the PDF report for investors who want comprehensive details. The professional formatting and objective AI analysis lend credibility to your updates.
Fundraising Conversations
Review the Performance Highlights and Detailed Financial Metrics before investor meetings to prepare for financial questions. Generate a fresh report to ensure you understand current risks and opportunities. Use the AI-generated insights to craft your narrative around growth, unit economics, and capital efficiency.
Internal Financial Review
Generate reports monthly to track financial trajectory even when not actively fundraising. Use the Strategic Recommendations to guide operational decisions. Monitor the Risk Factors & Warnings to catch issues early before they become critical.
Due Diligence Support
During fundraising due diligence, generate comprehensive reports showing historical trends and AI analysis. The detailed metrics table demonstrates data integrity and operational discipline. The AI insights show you understand your business deeply and proactively manage risks.
Relationship to Founder's View
Investor View complements Founder's View by providing different perspectives on your financial data. Founder's View focuses on scenario planning, forecasting, and cash flow modeling with interactive controls for adjusting assumptions and projecting different outcomes. Investor View focuses on historical analysis, current performance reporting, and generating narrative insights for external stakeholders.
Use Founder's View for internal planning, scenario testing, and strategic decisions about hiring, spending, or fundraising timing. Use Investor View for external communication, board reporting, and preparing materials for investors or advisors.
Both features pull from the same underlying data sources—your connected bank accounts, credit cards, Stripe data, and categorized transactions—ensuring consistency between internal planning and external reporting.
Why it matters: You need both perspectives to run your business effectively. Founder's View helps you decide where to go, while Investor View helps you explain where you've been and where you're heading to stakeholders who influence your access to capital.
Tips for Using Investor View
Generate reports regularly: Create reports monthly or before major meetings even if you don't immediately share them. This creates a historical record of AI analysis and helps you track how insights evolve as your business changes.
Review reports critically: The AI bases its analysis on your data. If data is incomplete, miscategorized, or anomalous, the insights will reflect those issues. Use report generation as a data quality check—if insights seem wrong, investigate your underlying transactions and categorization.
Prepare responses to risks: Never share a report with investors without first reading the Risk Factors & Warnings section and preparing explanations. If the AI flags an issue you can't explain, investigate before the board meeting rather than being surprised by questions.
Customize talking points: The AI-generated Talking Points provide a foundation, but tailor them to your specific audience. Add context, elaborate on positive metrics, or provide additional explanation for negative trends before sharing.
Export before meetings: Download PDF reports 24-48 hours before board meetings or investor calls. This gives stakeholders time to review and formulate questions, making meetings more productive than presenting data for the first time live.
Compare period over period: Use the detailed metrics table to understand trends, not just snapshots. One bad month might be an anomaly; three consecutive months of declining revenue is a pattern requiring strategy changes.
Validate projected months: The "PROJ" month in the detailed metrics table forecasts based on recent trends. If you know factors that will change future performance (major customer launches, planned cost reductions, seasonal variations), mentally adjust projections when reviewing.
Maintain categorization discipline: Accurate AI insights require accurate data. Keep transactions properly categorized in Reconciliations, assign correct department tags, and ensure revenue and expense categories reflect your actual business operations.
Use reports for goal-setting: Strategic Recommendations often suggest specific improvements. Turn these into quarterly OKRs or goals for your team. Generate reports quarterly to assess progress against previous recommendations.
Share selectively: Investor View shows comprehensive financial data. Consider who on your team should have access to this level of detail and whether certain metrics should remain confidential during early-stage hiring.